
Bitcoin’s recent price surge reflects investor optimism, exemplified by the Fear and Greed Index reaching levels not seen since November 2021. What lies ahead?
Between October and early November, Bitcoin’s price trajectory showcased a commendable uptrend, marking an impressive 34% increase from its starting point in the $27,000 range to a 16-month high of $35,919 on November 2.
Nevertheless, this optimistic atmosphere has somewhat cooled in light of the volatility stemming from the trial of cryptocurrency figure Sam Bankman-Fried, resulting in Bitcoin’s value stabilizing around the $34,200 mark as of November 3.
The rally witnessed in October can be attributed to a convergence of significant factors. Notably, the crypto community was invigorated by the prospect of the U.S. Securities and Exchange Commission (SEC) granting approval for a spot Bitcoin exchange-traded fund (ETF).
Furthermore, amidst global economic uncertainty heightened by ongoing geopolitical tensions, such as those in the Middle East and the Ukraine-Russia conflict, Bitcoin has increasingly been viewed as a safe-haven asset.
Another substantial influence is the anticipation of the 2024 Bitcoin halving. This event, which halves the reward for mining new blocks approximately every four years, is designed to counteract inflation within the Bitcoin ecosystem.
Historically, the impending halving has been associated with price surges, which may have played a role in Bitcoin’s ascent in October.
So, what’s the current state of the market, and where might BTC be heading next? Let’s delve into it.
Market Sentiments: Fear and Greed Index
The Fear and Greed Index serves as a sentiment indicator that assesses investor emotions and market sentiments. A higher index value signifies greed, while a lower value signifies fear.
As of November 3, this index for Bitcoin has been fluctuating in the mid-60s to low 70s range, indicating a prevalent sentiment of greed in the market.
This upsurge in optimism is largely attributed to Bitcoin’s recent price rally, with the index reaching a two-year high, matching levels last witnessed in November 2021 when Bitcoin reached an all-time high of $69,000.
Performance Relative to Traditional Markets
Concurrently, traditional markets have been displaying a downward trend, with indicators like the S&P 500 and NASDAQ reporting neutral or negative monthly returns, extending the losses from previous months.
This trend is often ascribed to uncertainties in the U.S. economic outlook and potential government shutdowns.
In stark contrast, Bitcoin has been outperforming traditional financial assets. An analysis by CryptoRank as of October 20, 2023, revealed that Bitcoin not only outperformed its closest cryptocurrency competitor, Ethereum (ETH), but also surpassed Gold, the NASDAQ index, and the SPY ETF.
Analysis of Bitcoin’s Technical Indicators
The emergence of a bullish pennant pattern on the daily bar chart, a common occurrence following a substantial upward move, suggests the potential for a sustained upward momentum.
Nevertheless, to preserve the bullish implications of this pattern, it is imperative for Bitcoin to break out to the upside in the near term. Currently, Bitcoin bulls hold the technical advantage, as evidenced by the established upward trend on the daily chart.
In a significant development, BTC has been hovering just below the critical $35,000 threshold, representing a notable resistance level from both a psychological and technical standpoint.
Despite a period of consolidation below this pivotal level, Bitcoin has managed to maintain its position above $34,000, hinting at potential preparations in the market for another upward surge.
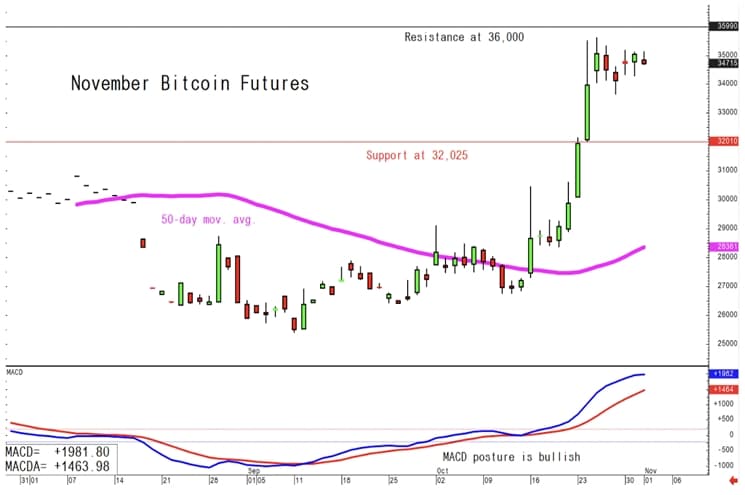
An examination of daily oscillators reveals a predominantly neutral stance, with nine out of eleven oscillators failing to provide a clear direction. However, the Moving Average Convergence Divergence (MACD) signals a buy, while the Relative Strength Index (RSI) remains in a neutral position.
On the other hand, moving averages paint a more bullish picture, with the majority residing in the buy zone. Twelve indicate a buy, only two point toward a sell, and one remains neutral.
This bullish sentiment gains further support from all long-term moving averages, including the SMA 50, SMA 100, SMA 200, EMA 50, EMA 100, and EMA 200, all of which indicate buy signals.
Currently, resistance levels are established at $36,000 and $37,000. A breakthrough above these levels could potentially open the door for a more substantial rally.
Conversely, a drop below the support level of $32,000 might invite bearish momentum. Both investors and traders should closely monitor these levels as Bitcoin navigates its technical landscape.